
Trends
Allows plotting the evolution of the value or indication of points in real time. A Graphic View must be predefined using the Point context menu, to which certain points of interest are added; then, when selected in this section, the evolution of the states and values of the composing points will be plotted over a defined time window. This feature might not be enabled in your license
Sampling of all defined Graphic Views starts once the user logs into EQUINOX Web. If the time window spans a period longer than the user’s connection time, the missing data is filled in using information from the historical value snapshots.
Access and usage
Access this section by selecting the corresponding tab, located after the Historian tab.
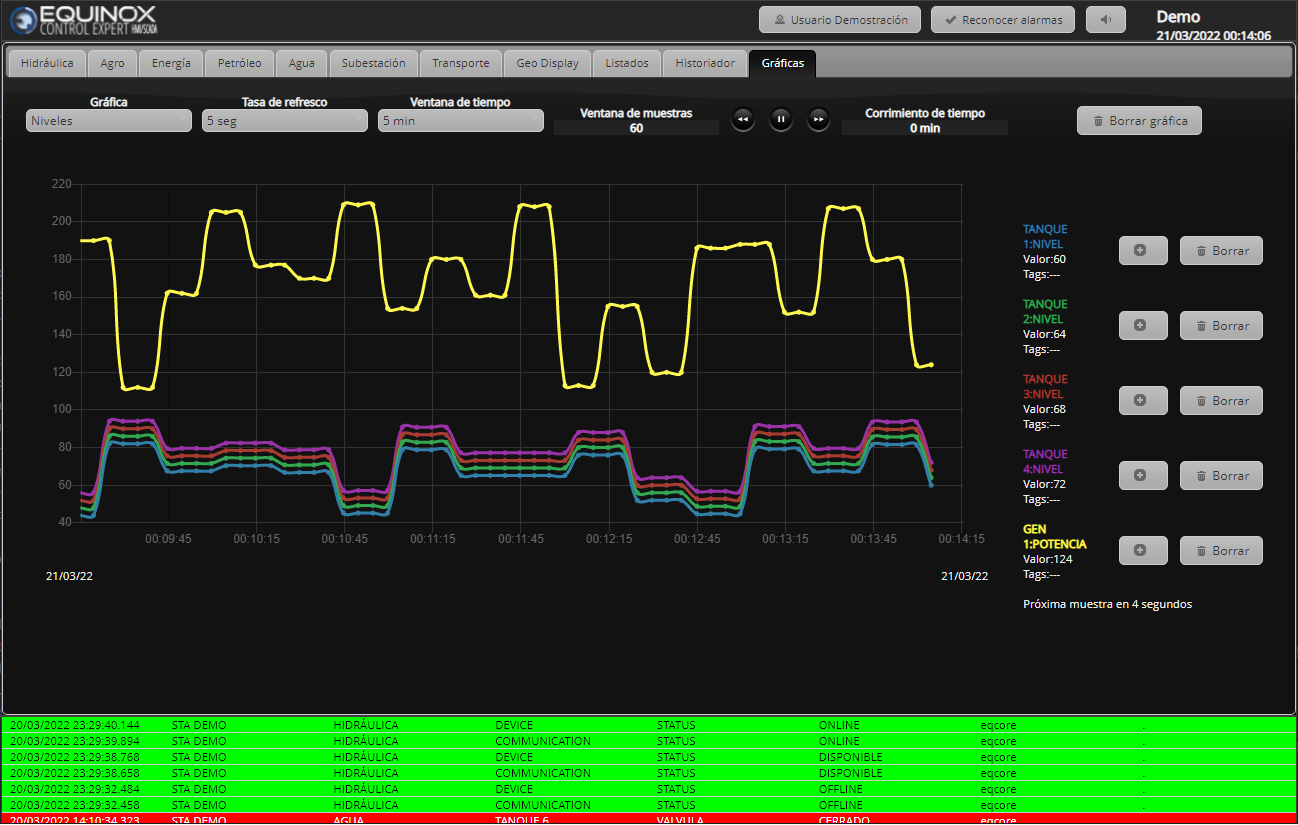
Buttons
| Function | |
|---|---|
| Selection of the Graphic View to display |  |
| Select the refresh rate in seconds |  |
| Select the time window in minutes, counting back from the current instant |  |
| View how many samples per point the chart holds (window / rate) | 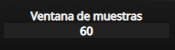 |
| Move forward/backward n time windows, freeze chart updating |  |
| View the time shift into the past (n time windows) | 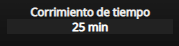 |
| Get the sample log of a point |  |
| Remove points from the Graphic View |  |
| Delete the Graphic View |  |